What is the Normal Distribution

The normal distribution is a probability distribution that describes how we often see data appear in the world around us. In this distribution, most values cluster around the average, and fewer spread out along the curve. But what does this really mean?

Imagine a thousand people walk into a bar, and as they enter, you measure each of their heights. If we were to plot these heights on a histogram, something curious happens. Most people fall in the middle, with just a few outliers on either side.

What about something different than height? What about the daily revenue of Cafe Socratica over a year? Some days are great, other days are quiet, but most hover around a typical number. If we were to plot these daily revenues, we would see the same smooth peak.

Naming the Pattern: The "Normal" Distribution

Believe it or not, we do not call normal distributions "normal" because there are other distributions that are considered "abnormal." But rather, because this distribution is so common—we see it in nature all the time!

Informally, the shape of this distribution is called a bell curve because it looks like the outline of a bell. It is round on top, and tapers smoothly down both sides.

However, the word "distribution" is a bit more complicated to summarize, so most people turn to the graph of the distribution. The graph tells you which data are common, and which data are rare. The taller the curve at a particular point, the more frequently those points tend to appear in the data. Meanwhile, where the curve is low, these values do not come up as often.

Anatomy of the Normal Curve

Mean & Standard Deviation

Up to this point, it might seem like all normal distributions are the same, and this is NOT the case. There is a way to tell the difference between these normal distributions like the height of people and the revenue of Cafe Socratica. 

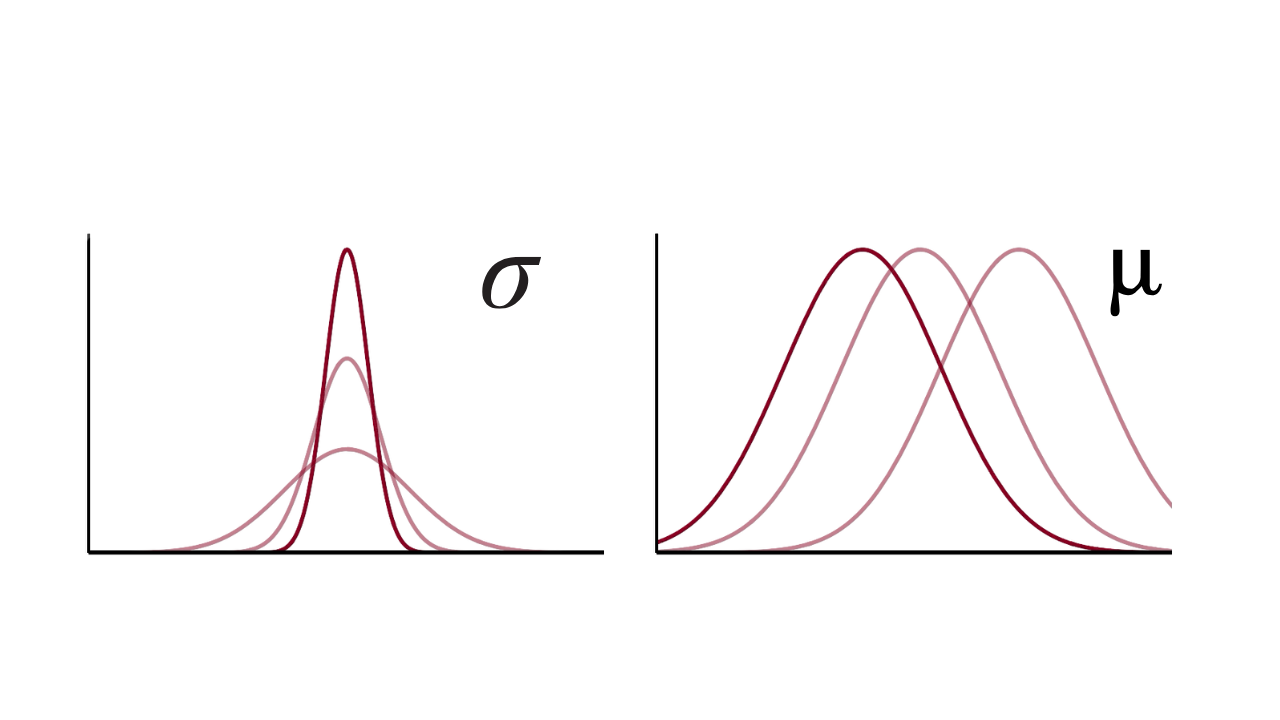
It turns out you only need two numbers: one for the peak, and one for the taper. Together, these numbers control the bell shape of any normal distribution. 

The first is the mean, written with the Greek letter mu—μ. This is the average, or the center of the distribution. The mean tells us where exactly the peak sits. 

The second is the standard deviation, written with the greek letter sigma—𝜎. This tells us how spread out the values are.